Your First Backtest
In this guide, you'll create your backtest using Vaanam's Backester. Backtester allows you to define a strategy and run it on 20+ years of historical data. Lets you analyze the potential of a strategy.
Past performance does not guarantee future results
Access the Strategy Builder
The Backtest feature is available under the Strategies section in the top menu. Clicking it will take you to the Backtest workspace.
We will test a simple strategy of Larry Connor's RSI 2 on the SP500 ETF SPY
Entry
- RSI(2) < 10
- Buy at next day’s open
Exit
- RSI(2) > 90
- Sell at next day’s open
Backtest Form has 3 Sections
General Section

- Strategy Name - RSI2
- Universe Selection - SPY
- Backtest Period - Selected from 2006 - 2025
- Capital - 100000 USD
- Allocation - 100% of capital is allocated to the trades
Logic Section

- Entry Logic query using AI - previous day's rsi 2 is less than 10
- When to Buy - Open
- Exit Logic query using AI - previous day's rsi 2 is less than 90
- When to Exit - Open
- Generate - Clicking on generate will populate the queries in Query forms, or you can fill the query directly without using AI
Risk & Settings Section

- Rebalance Frequency - Daily
- Time Frame - Daily
- Commission per Trade - 0.05%
- Slippage per Trade - 0.05%
Click on Save/Run Backtest, backtest will be submitted and executed. You will be redirected to the Results
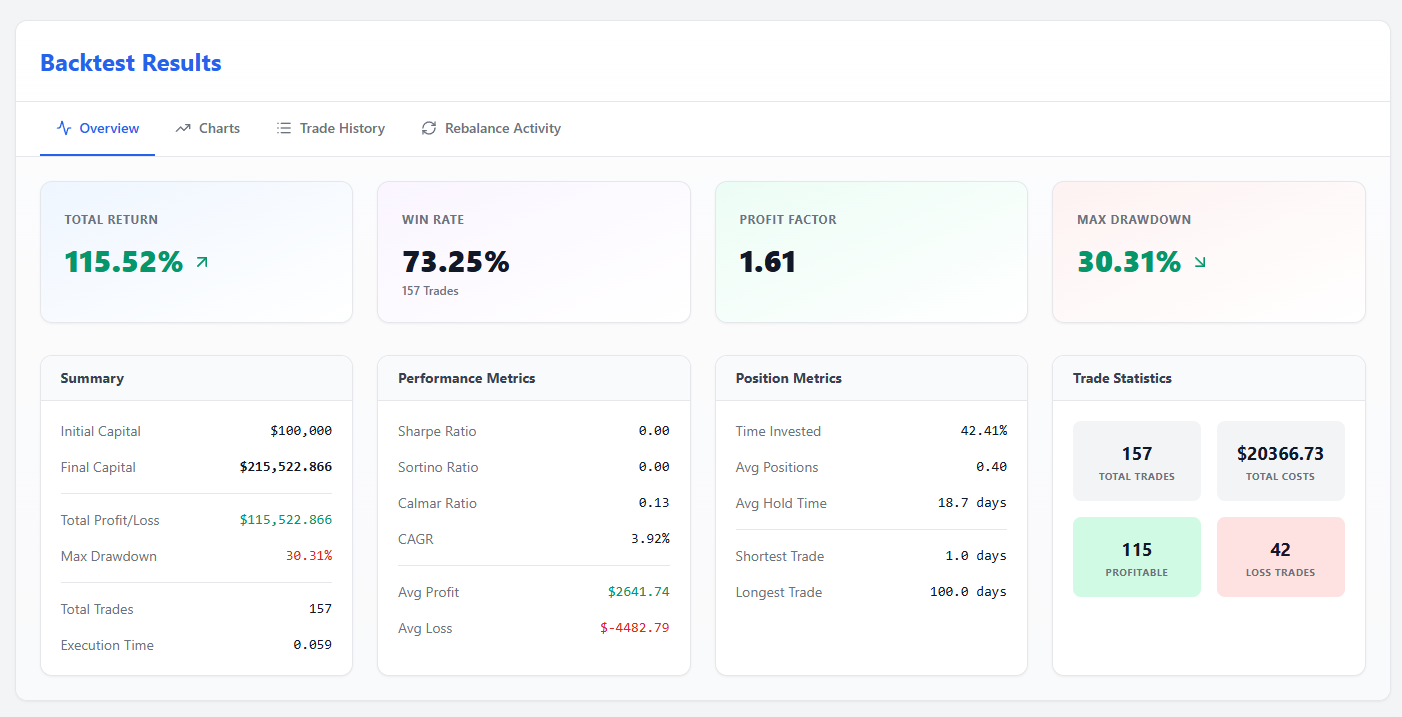
Backtest Result Overview
The overview summarizes the strategy’s performance, including total return, drawdown, and win rate. These metrics help you quickly assess whether the strategy is viable.
Backtest Result Charts

We have two other sections in the results -
- Trade History - View all trades executed during the backtest
- Rebalance Activity - View all rebalance activities during the backtest
What’s Next?
You’ve successfully created and run your first backtest using a simple RSI(2) strategy on SPY.
This example demonstrates how to define entry and exit rules, configure risk settings, and analyze historical performance.
Next, try experimenting with:
- Different indicators or parameter values
- Adding stop-loss or take-profit rules
- Testing the strategy on other symbols or timeframes
As you iterate, focus on understanding drawdowns and consistency—not just total returns.
© 2026 Vaanam, Inc. All rights reserved.